TiDB Best Practices on Public Cloud
Public cloud infrastructure has become an increasingly popular choice for deploying and managing TiDB. However, deploying TiDB on public cloud requires careful consideration of several critical factors, including performance tuning, cost optimization, reliability, and scalability.
This document covers various essential best practices for deploying TiDB on public cloud, such as using a dedicated disk for Raft Engine, reducing compaction I/O flow in KV RocksDB, optimizing costs for cross-AZ traffic, mitigating Google Cloud live migration events, and fine-tuning the PD server in large clusters. By following these best practices, you can maximize the performance, cost efficiency, reliability, and scalability of your TiDB deployment on public cloud.
Use a dedicated disk for Raft Engine
The Raft Engine in TiKV plays a critical role similar to that of a write-ahead log (WAL) in traditional databases. To achieve optimal performance and stability, it is crucial to allocate a dedicated disk for the Raft Engine when you deploy TiDB on public cloud. The following iostat shows the I/O characteristics on a TiKV node with a write-heavy workload.
Device            r/s     rkB/s       w/s     wkB/s      f/s  aqu-sz  %util
sdb           1649.00 209030.67   1293.33 304644.00    13.33    5.09  48.37
sdd           1033.00   4132.00   1141.33  31685.33   571.00    0.94 100.00
The device sdb is used for KV RocksDB, while sdd is used to restore Raft Engine logs. Note that sdd has a significantly higher f/s value, which represents the number of flush requests completed per second for the device. In Raft Engine, when a write in a batch is marked synchronous, the batch leader will call fdatasync() after writing, guaranteeing that buffered data is flushed to the storage. By using a dedicated disk for Raft Engine, TiKV reduces the average queue length of requests, thereby ensuring optimal and stable write latency.
Different cloud providers offer various disk types with different performance characteristics, such as IOPS and MBPS. Therefore, it is important to choose an appropriate cloud provider, disk type, and disk size based on your workload.
Choose appropriate disks for Raft Engine on public clouds
This section outlines best practices for choosing appropriate disks for Raft Engine on different public clouds. Depending on performance requirements, two types of recommended disks are available.
Middle-range disk
The following are recommended middle-range disks for different public clouds:
On AWS, gp3 is recommended. The gp3 volume offers a free allocation of 3000 IOPS and 125 MB/s throughput, regardless of the volume size, which is usually sufficient for the Raft Engine.
On Google Cloud, pd-ssd is recommended. The IOPS and MBPS vary depending on the allocated disk size. To meet performance requirements, it is recommended to allocate 200 GB for Raft Engine. Although Raft Engine does not require such a large space, it ensures optimal performance.
On Azure, Premium SSD v2 is recommended. Similar to AWS gp3, Premium SSD v2 provides a free allocation of 3000 IOPS and 125 MB/s throughput, regardless of the volume size, which is usually sufficient for Raft Engine.
High-end disk
If you expect an even lower latency for Raft Engine, consider using high-end disks. The following are recommended high-end disks for different public clouds:
On AWS, io2 is recommended. Disk size and IOPS can be provisioned according to your specific requirements.
On Google Cloud, pd-extreme is recommended. Disk size, IOPS, and MBPS can be provisioned, but it is only available on instances with more than 64 CPU cores.
On Azure, ultra disk is recommended. Disk size, IOPS, and MBPS can be provisioned according to your specific requirements.
Example 1: Run a social network workload on AWS
AWS offers 3000 IOPS and 125 MBPS/s for a 20 GB gp3 volume.
By using a dedicated 20 GB gp3 Raft Engine disk on AWS for a write-intensive social network application workload, the following improvements are observed but the estimated cost only increases by 0.4%:
- a 17.5% increase in QPS (queries per second)
- an 18.7% decrease in average latency for insert statements
- a 45.6% decrease in p99 latency for insert statements.
| Metric | Shared Raft Engine disk | Dedicated Raft Engine disk | Difference (%) |
|---|---|---|---|
| QPS (K/s) | 8.0 | 9.4 | 17.5 |
| AVG Insert Latency (ms) | 11.3 | 9.2 | -18.7 |
| P99 Insert Latency (ms) | 29.4 | 16.0 | -45.6 |
Example 2: Run TPC-C/Sysbench workload on Azure
By using a dedicated 32 GB ultra disk for Raft Engine on Azure, the following improvements are observed:
- Sysbench
oltp_read_writeworkload: a 17.8% increase in QPS and a 15.6% decrease in average latency. - TPC-C workload: a 27.6% increase in QPS and a 23.1% decrease in average latency.
| Metric | Workload | Shared Raft Engine disk | Dedicated Raft Engine disk | Difference (%) |
|---|---|---|---|---|
| QPS (K/s) | Sysbench oltp_read_write | 60.7 | 71.5 | 17.8 |
| QPS (K/s) | TPC-C | 23.9 | 30.5 | 27.6 |
| AVG Latency (ms) | Sysbench oltp_read_write | 4.5 | 3.8 | -15.6 |
| AVG Latency (ms) | TPC-C | 3.9 | 3.0 | -23.1 |
Example 3: Attach a dedicated pd-ssd disk on Google Cloud for Raft Engine on TiKV manifest
The following TiKV configuration example shows how to attach an additional 512 GB pd-ssd disk to a cluster on Google Cloud deployed by TiDB Operator, with raft-engine.dir configured to store Raft Engine logs to this specific disk.
tikv:
    config: |
      [raft-engine]
        dir = "/var/lib/raft-pv-ssd/raft-engine"
        enable = true
        enable-log-recycle = true
    requests:
      storage: 4Ti
    storageClassName: pd-ssd
    storageVolumes:
    - mountPath: /var/lib/raft-pv-ssd
      name: raft-pv-ssd
      storageSize: 512Gi
Reduce compaction I/O flow in KV RocksDB
As the storage engine of TiKV, RocksDB is used to store user data. Because the provisioned IO throughput on cloud EBS is usually limited due to cost considerations, RocksDB might exhibit high write amplification, and the disk throughput might become the bottleneck for the workload. As a result, the total number of pending compaction bytes grows over time and triggers flow control, which indicates that TiKV lacks sufficient disk bandwidth to keep up with the foreground write flow.
To alleviate the bottleneck caused by limited disk throughput, you can improve performance by increasing the compression level for RocksDB and reducing the disk throughput. For example, you can refer to the following example to increase all the compression levels of the default column family to zstd.
[rocksdb.defaultcf]
compression-per-level = ["zstd", "zstd", "zstd", "zstd", "zstd", "zstd", "zstd"]
Optimize cost for cross-AZ network traffic
Deploying TiDB across multiple availability zones (AZs) can lead to increased costs due to cross-AZ data transfer fees. To optimize costs, it is important to reduce cross-AZ network traffic.
To reduce cross-AZ read traffic, you can enable the Follower Read feature, which allows TiDB to prioritize selecting replicas in the same availability zone. To enable this feature, set the tidb_replica_read variable to closest-replicas or closest-adaptive.
To reduce cross-AZ write traffic in TiKV instances, you can enable the gRPC compression feature, which compresses data before transmitting it over the network. The following configuration example shows how to enable gzip gRPC compression for TiKV.
server_configs:
  tikv:
    server.grpc-compression-type: gzip
To reduce network traffic caused by the data shuffle of TiFlash MPP tasks, it is recommended to deploy multiple TiFlash instances in the same availability zones (AZs). Starting from v6.6.0, compression exchange is enabled by default, which reduces the network traffic caused by MPP data shuffle.
Mitigate live migration maintenance events on Google Cloud
The Live Migration feature of Google Cloud enables VMs to be seamlessly migrated between hosts without causing downtime. However, these migration events, although infrequent, can significantly impact the performance of VMs, including those running in a TiDB cluster. During such events, affected VMs might experience reduced performance, leading to longer query processing times in the TiDB cluster.
To detect live migration events initiated by Google Cloud and mitigate the performance impact of these events, TiDB provides a watching script based on Google's metadata example. You can deploy this script on TiDB, TiKV, and PD nodes to detect maintenance events. When a maintenance event is detected, appropriate actions can be taken automatically as follows to minimize disruption and optimize the cluster behavior:
- TiDB: Takes the TiDB node offline by cordoning it and deleting the TiDB pod. This assumes that the node pool of the TiDB instance is set to auto-scale and dedicated to TiDB. Other pods running on the node might experience interruptions, and the cordoned node is expected to be reclaimed by the auto-scaler.
- TiKV: Evicts leaders on the affected TiKV store during maintenance.
- PD: Resigns a leader if the current PD instance is the PD leader.
It is important to note that this watching script is specifically designed for TiDB clusters deployed using TiDB Operator, which offers enhanced management functionalities for TiDB in Kubernetes environments.
By utilizing the watching script and taking necessary actions during maintenance events, TiDB clusters can better handle live migration events on Google Cloud and ensure smoother operations with minimal impact on query processing and response times.
Tune PD for a large-scale TiDB cluster with high QPS
In a TiDB cluster, a single active Placement Driver (PD) server is used to handle crucial tasks such as serving the TSO (Timestamp Oracle) and processing requests. However, relying on a single active PD server can limit the scalability of TiDB clusters.
Symptoms of PD limitation
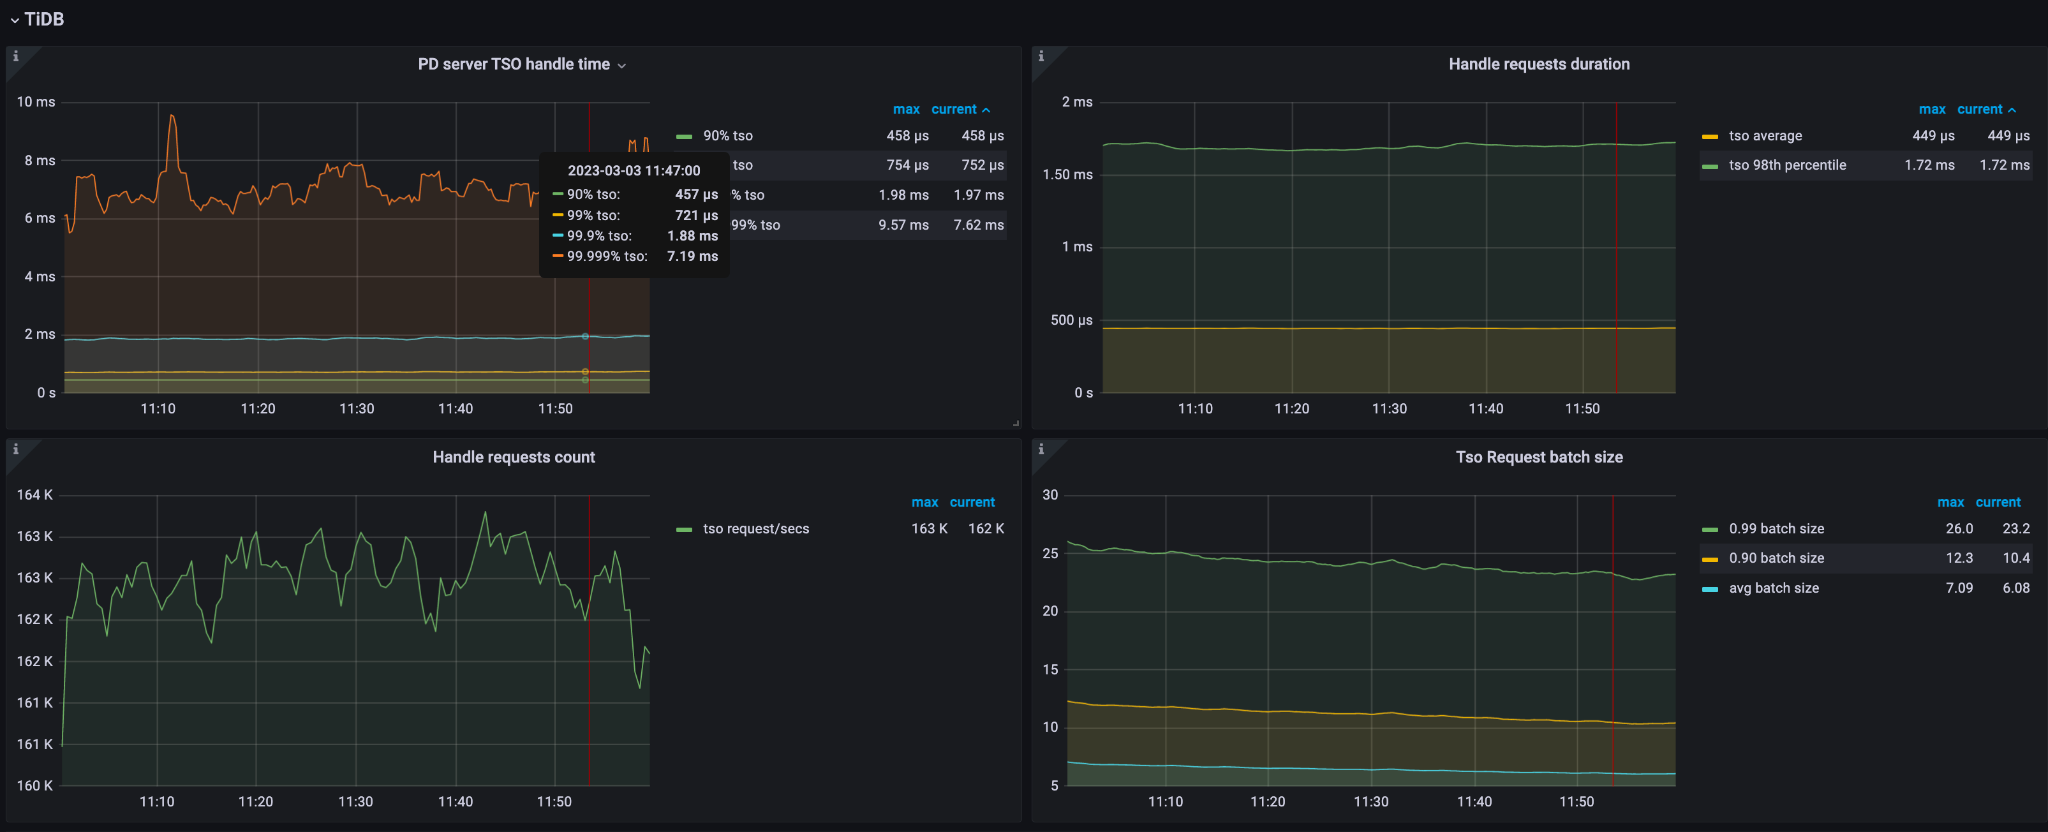
The following diagrams show the symptoms of a large-scale TiDB cluster consisting of three PD servers, each equipped with 56 CPUs. From these diagrams, it is observed that when the query per second (QPS) exceeds 1 million and the TSO (Timestamp Oracle) requests per second exceed 162,000, the CPU utilization reaches approximately 4,600%. This high CPU utilization indicates that the PD leader is experiencing a significant load and is running out of available CPU resources.


Tune PD performance
To address the high CPU utilization issue in the PD server, you can make the following tuning adjustments:
Adjust PD configuration
tso-update-physical-interval: This parameter controls the interval at which the PD server updates the physical TSO batch. By reducing the interval, the PD server can allocate TSO batches more frequently, thereby reducing the waiting time for the next allocation.
tso-update-physical-interval = "10ms" # default: 50ms
Adjust a TiDB global variable
In addition to the PD configuration, enabling the TSO client batch wait feature can further optimize the TSO client's behavior. To enable this feature, you can set the global variable tidb_tso_client_batch_max_wait_time to a non-zero value.
set global tidb_tso_client_batch_max_wait_time = 2; # default: 0
Adjust TiKV configuration
To reduce the number of Regions and alleviate the heartbeat overhead on the system, it is recommended to increase the Region size in the TiKV configuration from 96MB to 256MB.
[coprocessor]
  region-split-size = "256MB"
After tuning
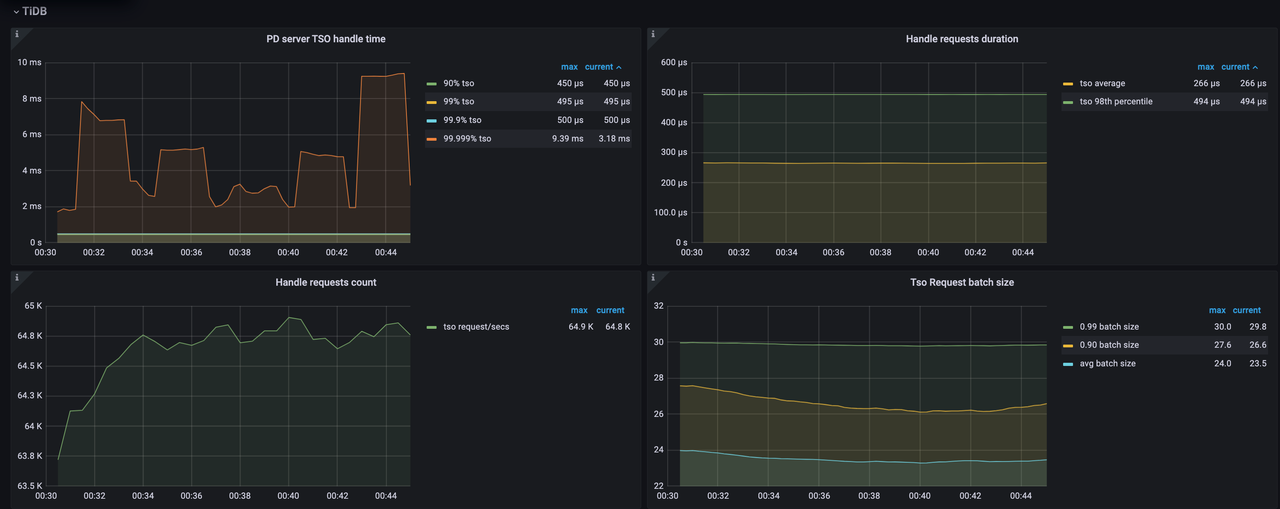
After the tuning, the following effects can be observed:
- The TSO requests per second are decreased to 64,800.
- The CPU utilization is significantly reduced from approximately 4,600% to 1,400%.
- The P999 value of
PD server TSO handle timeis decreased from 2ms to 0.5ms.
These improvements indicate that the tuning adjustments have successfully reduced the CPU utilization of the PD server while maintaining stable TSO handling performance.

